
Tennis court occupancy: what statistics tell your committee
“The courts are always full” and “Nobody plays on Monday” are both heard at many clubs. Which one is true? Booking statistics give the committee facts instead of impressions, and better decisions follow.
Busiest days and times
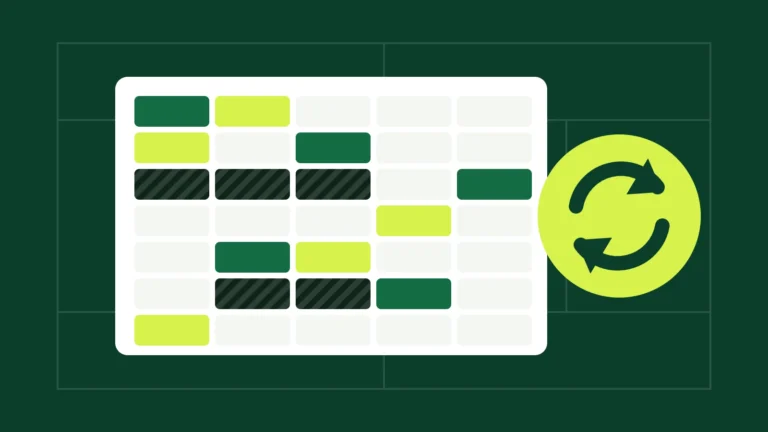
Look at bookings per day of the week and per hour. Most clubs see a peak on weekday evenings and Saturday morning. Quiet moments are an opportunity: plan lessons, youth training or social tennis there, so peak hours stay free for members.
Occupancy per court
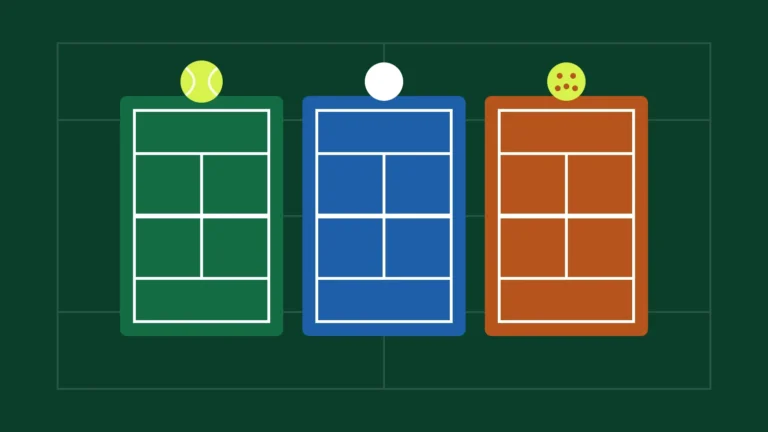
Is one court always booked and another hardly ever? That may say something about the surface, the lighting or the location. Occupancy per court also helps when you consider adding padel or pickleball: is there room to convert a court?
Trend per month
The monthly trend shows the season: the spring start, the summer dip and the autumn. Compare years to see whether the club is growing, and whether a new rule or activity has had effect.
Members and cancellations
- Most active members: who keeps the club going? Thank them, or ask them to help with events.
- Most cancellations: members who cancel often may need a reminder, or the rules may be too strict.
- Inactive members: a personal message may bring them back to the court.
From numbers to decisions
Statistics are only useful if you act on them. Discuss them once per quarter in the committee meeting, choose one or two improvements and look at the effect three months later. Keep privacy in mind: share aggregate figures with members, not individual names.
How BoardIt helps
The statistics of BoardIt Pro show the busiest days and times, occupancy per court, the monthly trend, the most active members and the most cancellations, right in your WordPress dashboard. Old bookings are anonymised automatically after a period you choose.
BoardIt is a WordPress plugin: you need your own WordPress website to use it. The free version has no limit on courts, members or bookings.